Changelog
New updates and improvements to StackScout.
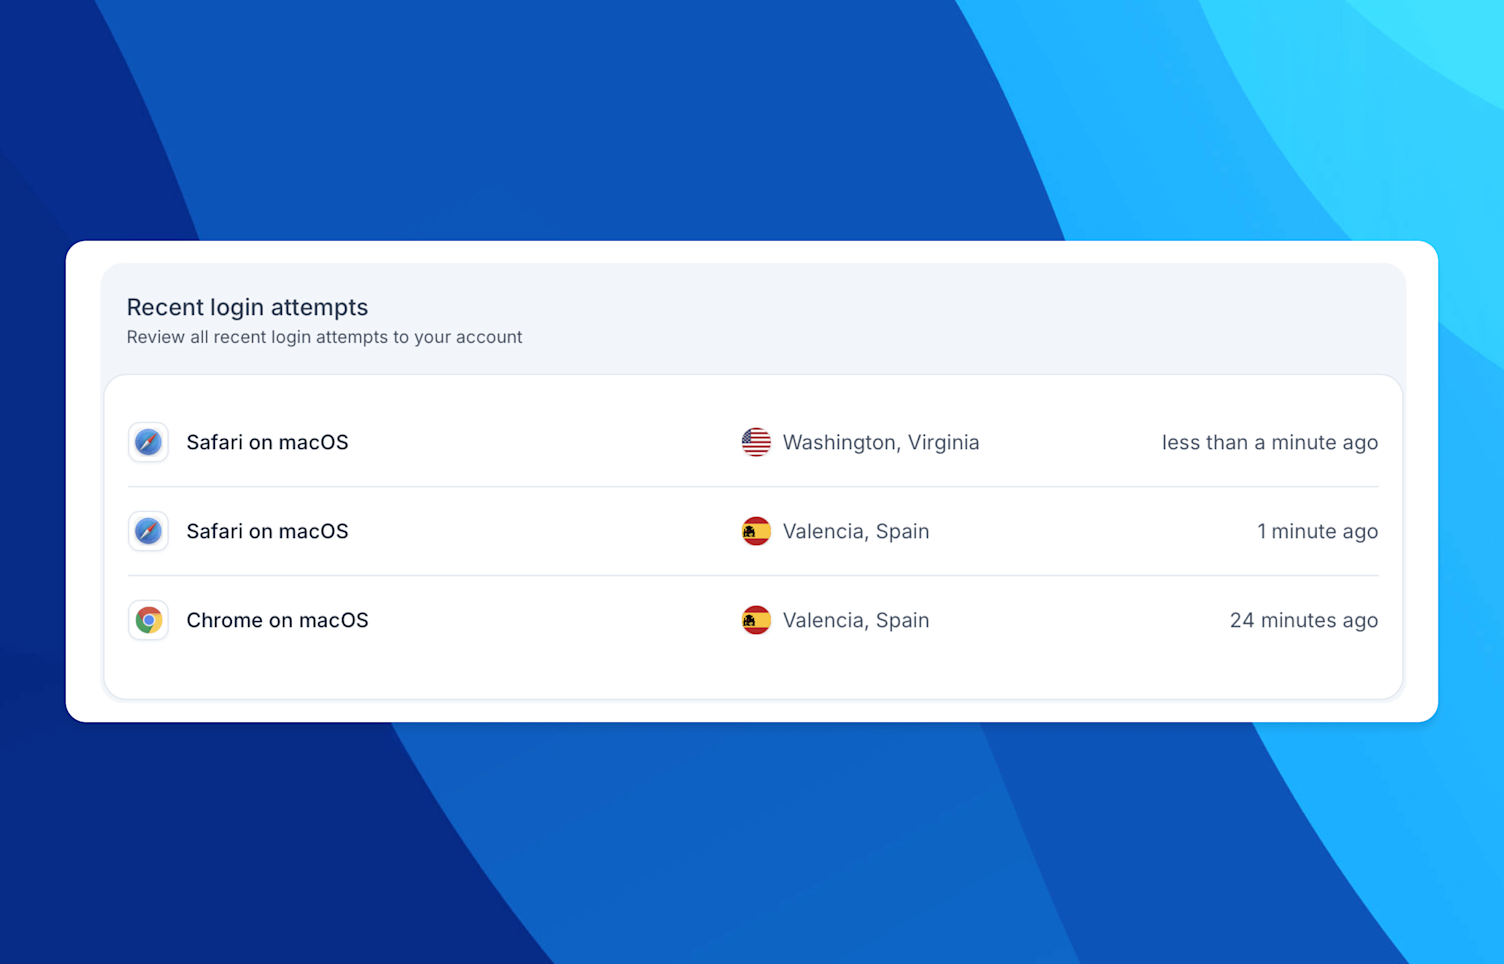
Recent login attempts
You can now view your recent login attempts directly from your Profile Preferences page. Each attempt includes location data and marks whether it was successful or unsuccessful, giving you clearer insight into your account security.
Other improvements
we've improved performance of the initial load of the Incidents screen
squashed miscellaneous minor bugs
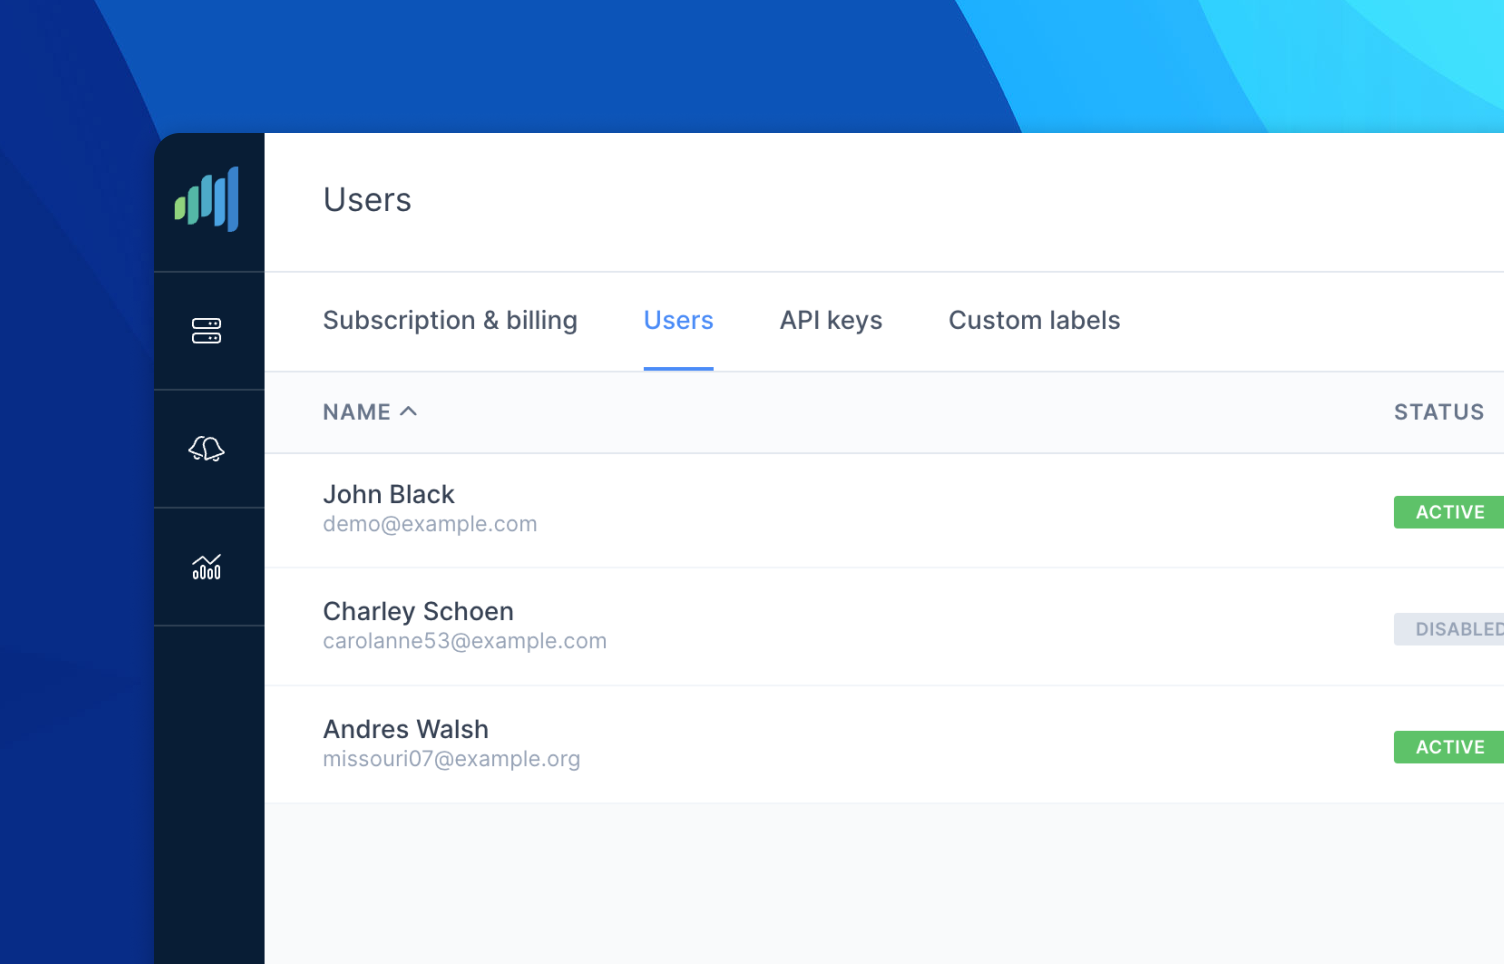
User management
You can now add your coworkers to your StackScout account. Head over to Manage module where you'll find a list of account users. You can add more users, (as many as you need) enable/disable their status, reset password, or remove them from your account completely.
Other bug fixes and tweaks
users will now be redirected back to the original page they requested after logging in if they try to access a StackScout page while not signed in
reloading any of the reports will now present a nicer UI, which doesn’t hide the report output while the new one is generated
fixed a validation issue where you couldn't create or save a notification channel after switching the type using a dropdown
added CPU information and usage telemetry data for M1 Apple Macs
reduced “jumping” of the “Test credentials” button on the automatic agent installation screen
fixed a bug where the automatic agent installation progress would not update automatically
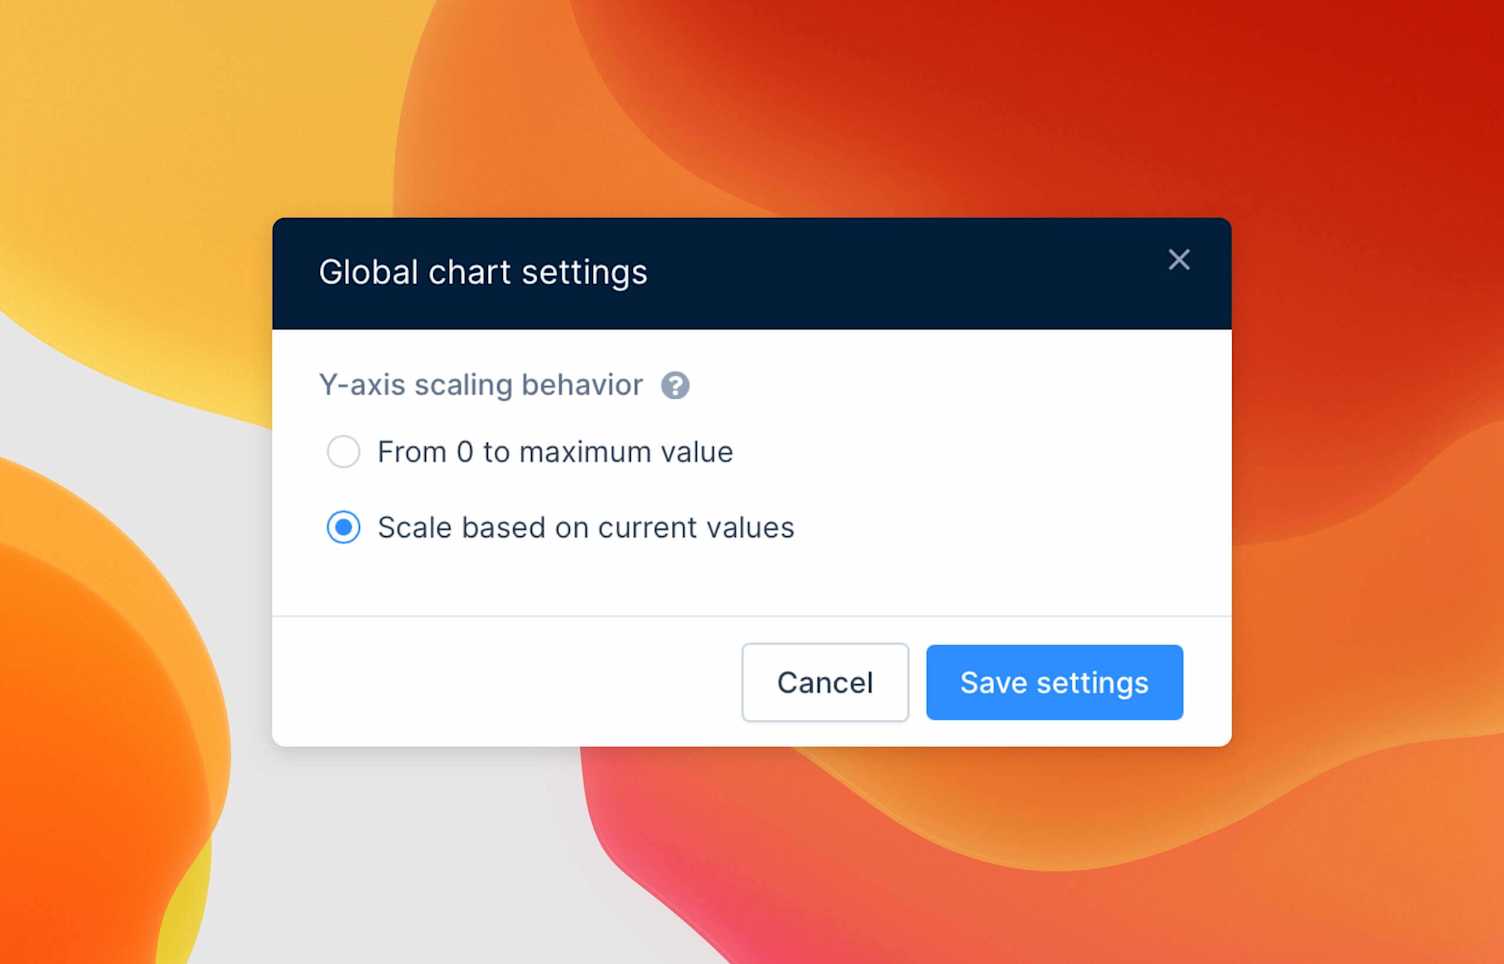
Chart settings
In this update we've introduced a global chart settings modal that allows updating the behavior of the Y-axis on all charts in the server details view. You can switch between showing the scale from 0 to the max possible value (i.e. 100% for CPU usage, or total memory available) and scaling relatively based on the data on the chart. The latter case will be useful if the measurements don't change much over time. Changed settings will be persisted and affect all server views.
In addition to that, we've also added ability to view each chart in the full screen mode.
Other bug fixes and tweaks
fixed placement of the toast messages
updated the toast message colors to provide bigger contracts against the page background
various other improvements and bug fixes
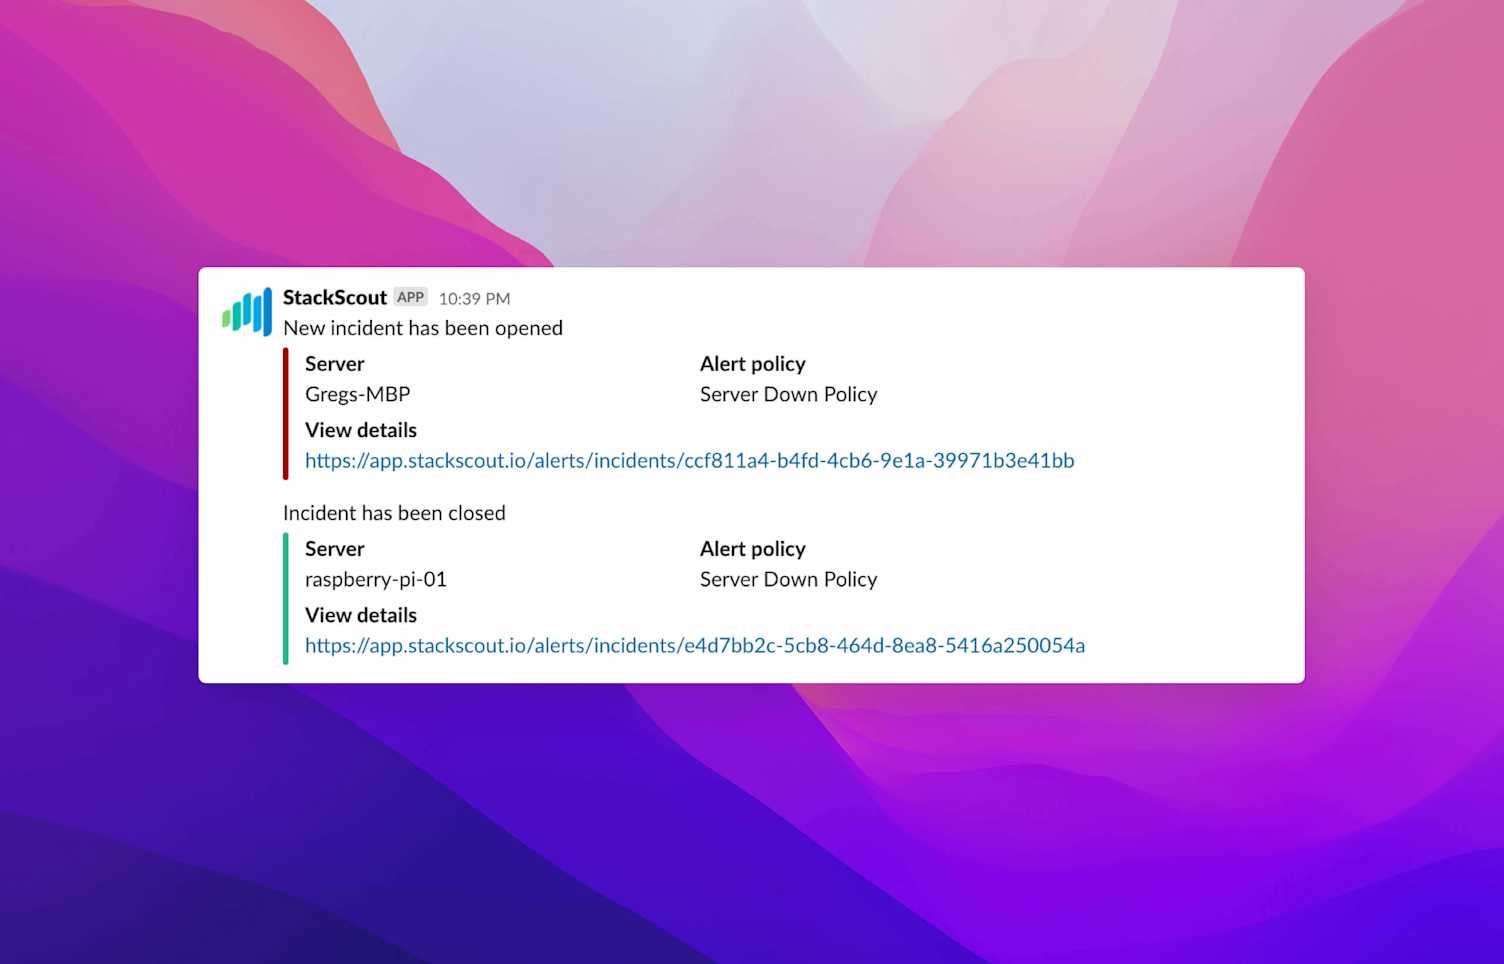
Slack integration
One of our goals building StackScout is to make sure the platform works with all the tooling that you may already be using. Today we’re announcing Slack integration, which will allow you to route any notifications for alert policy breaches, as well as subsequent recoveries.
In order to get started, create a new notification channel, select Slack at the channel type and provide a URL (which you can get by adding Incoming Webhook integration for your Slack organization) and the Slack channel which StackScout should send the notifications to.
Other bug fixes and tweaks
added missing Digital Ocean icon to the server details screen
fixed an issue with the tags filter not allowing single tag to be selected
fixed an bug occurring on Safari which prevented users from uploading a private key in the automatic monitoring agent installation process
Introducing reports
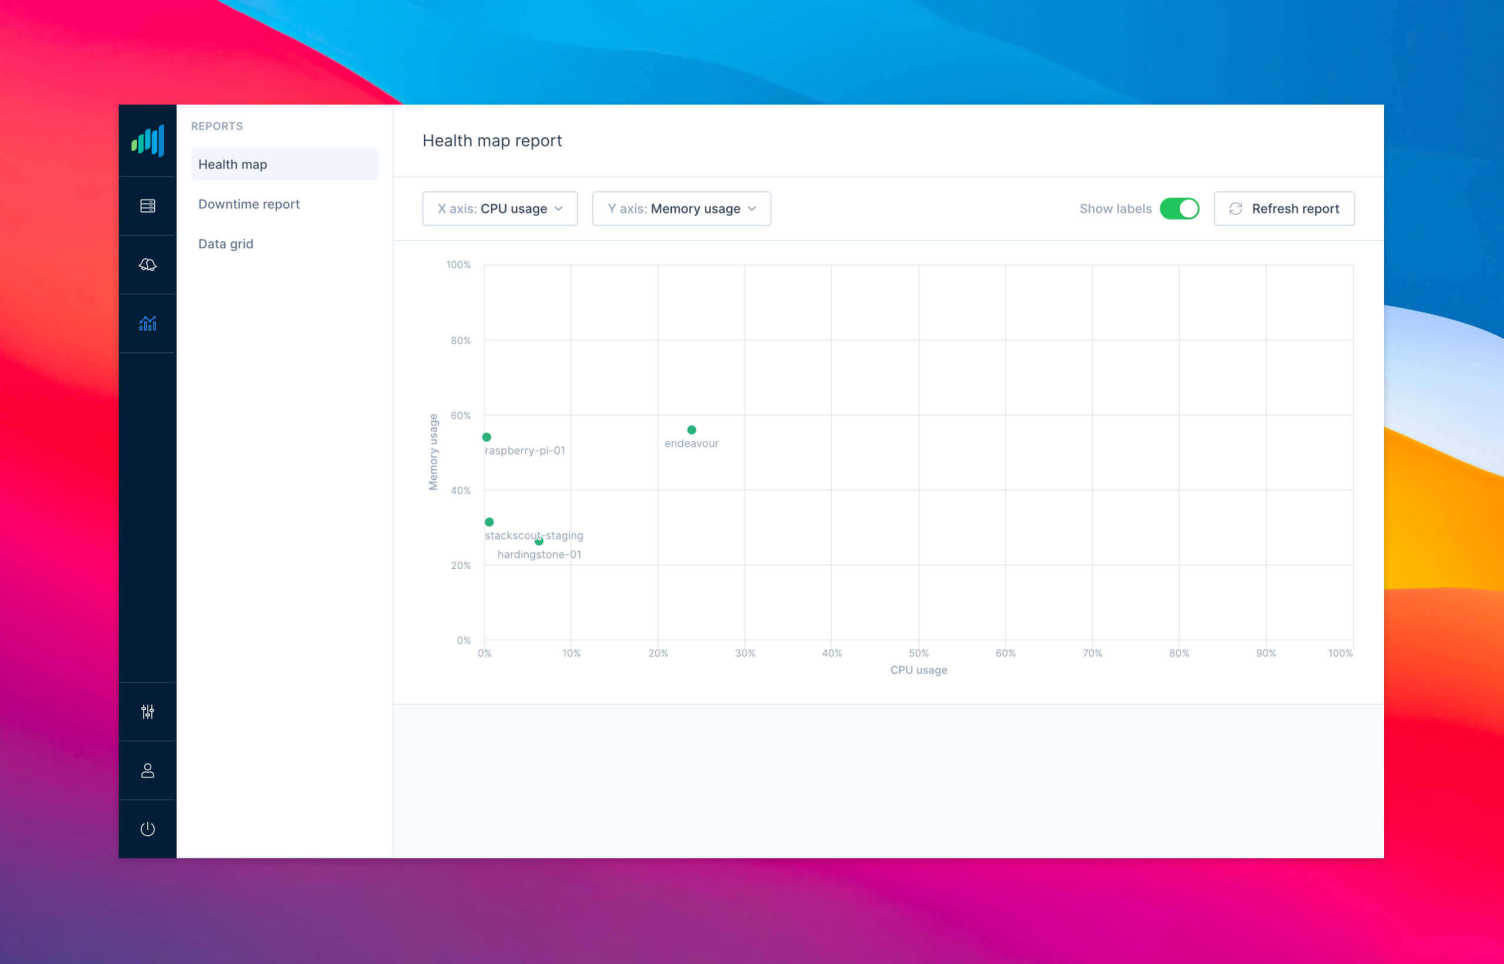
In our ongoing effort of making it easier and faster to get an overview of your architecture, we've now added three new report types:
Health map
Downtime report
Data grid
You can access all of the reports using Analytics tab in the sidebar.
Other bug fixes and tweaks
UI and UX improvements to the server list view
Added ability to quickly filter the server list by tags
Added ability to regenerate API key
Automatic monitoring agent installation
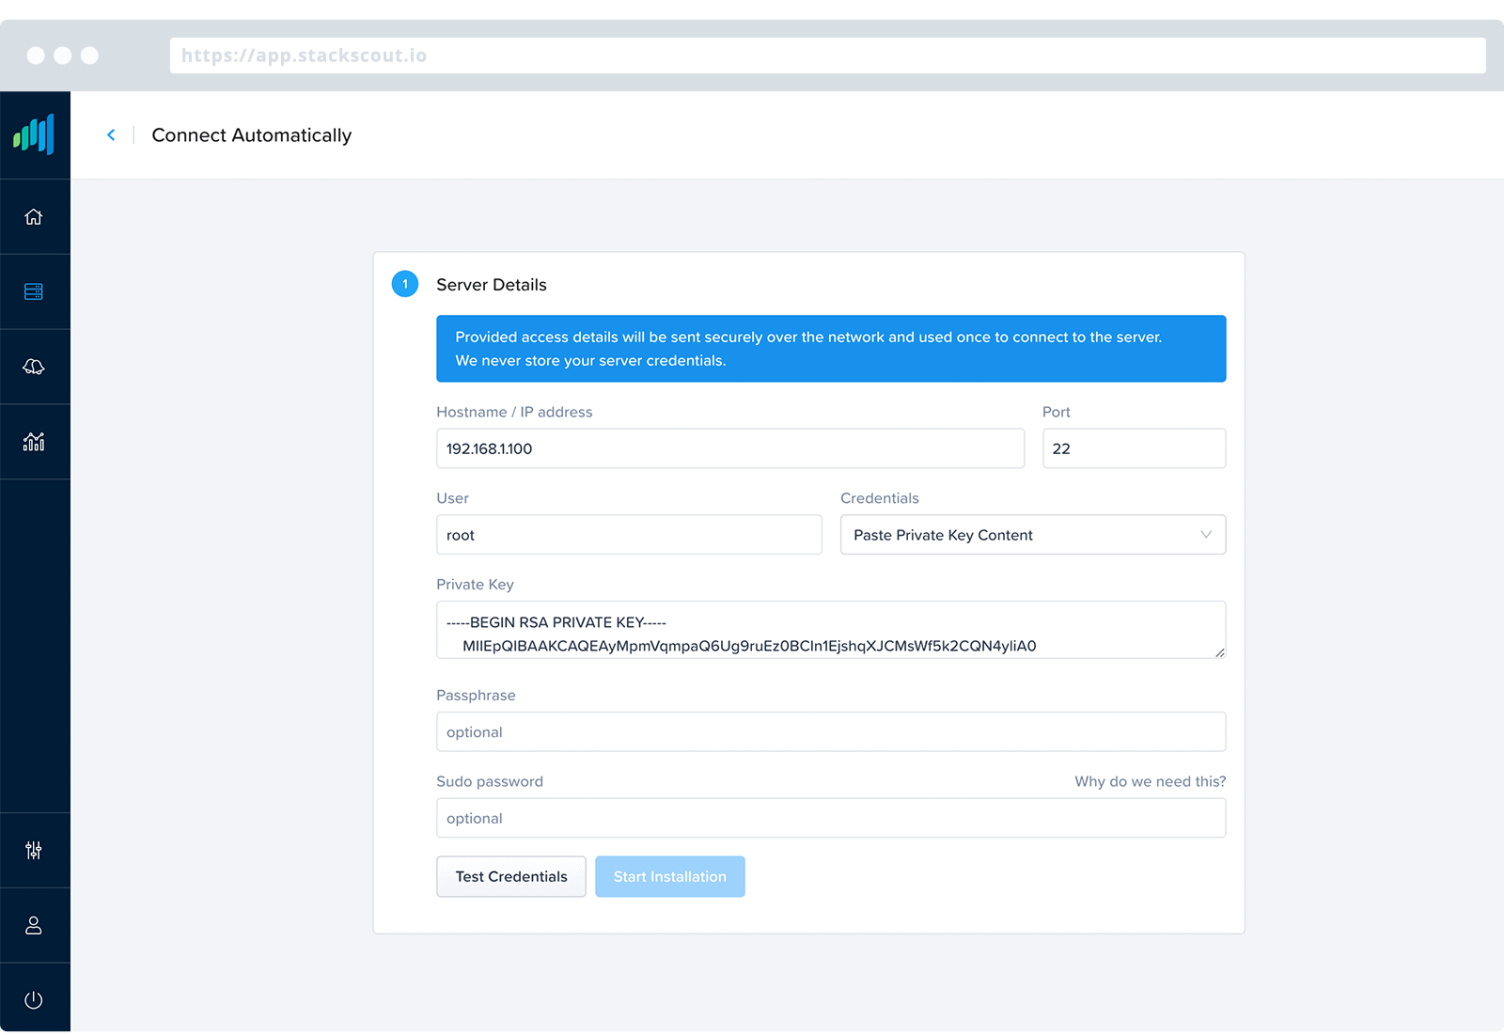
StackScout monitoring agent (a small program that runs on server/machine in the background and reports the metrics) can now be installed automatically. Just provide the SSH access credentials (we support both password and private key logins, including passphrase protected) which are never stored by us and the agent program will be installed automatically.
Other improvements
You can now navigate between the screens on mobile using the overlay menu
Dashboard can be launched into a "Kiosk Mode" which hides all unnecessary UI elements (useful for casting dashboards onto TV screens)
Monitoring agent can now be installed on ARM based machines (e.g. Raspberry Pi)
Server availability widget
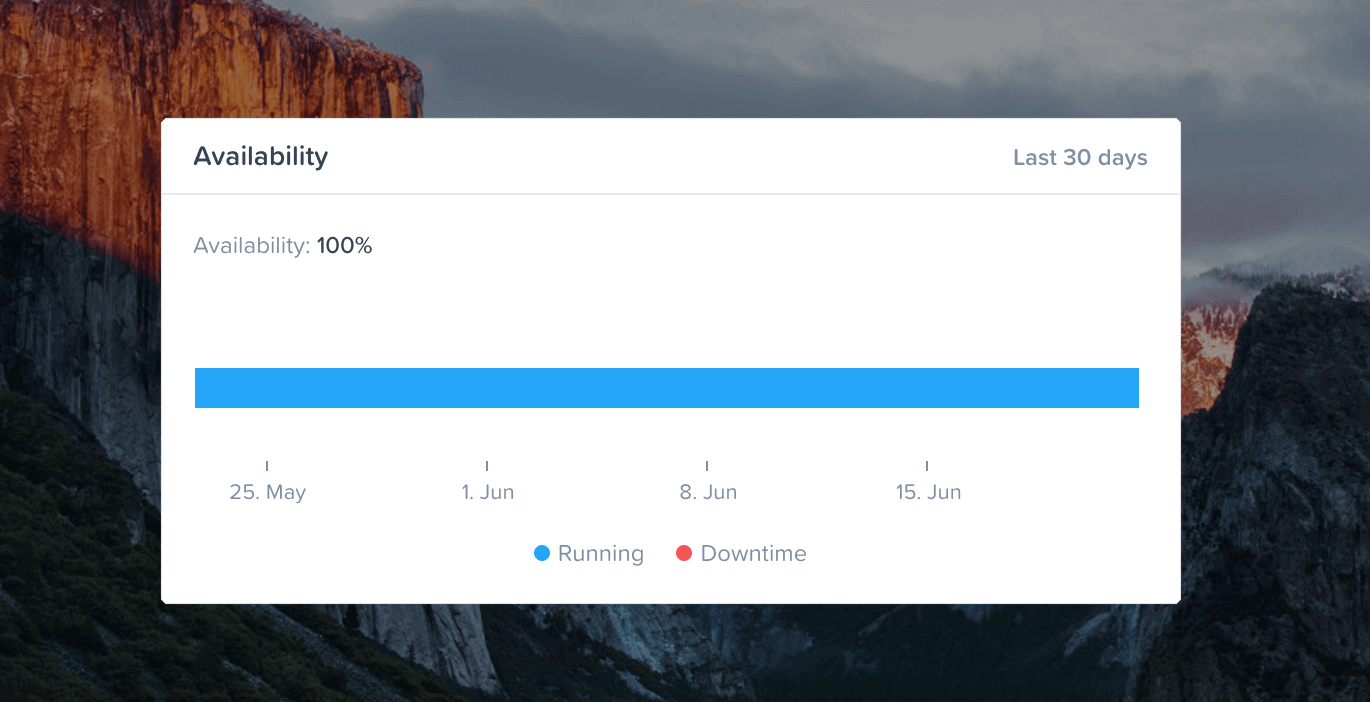
StackScout server details page now has the Availability card that shows the uptime in the last 30 days, both as a percentage of time the machine was up and in a visual way.
Other improvements
Cloud detection (for AWS, Azure, Digital Ocean and Google Cloud)
Server location detection
